Creating and Modifying Grafana Dashboards
Introduction
A short tutorial that walks you through the basics of creating and modifying a Grafana dashboard.
Prerequisites
If you haven’t installed Grafana yet, make sure that you have a computer that can run it (255MB and 1 CPU), a supported browser like Safari or Chrome, and a supported database to store the info like MySQL.
Creating a Dashboard
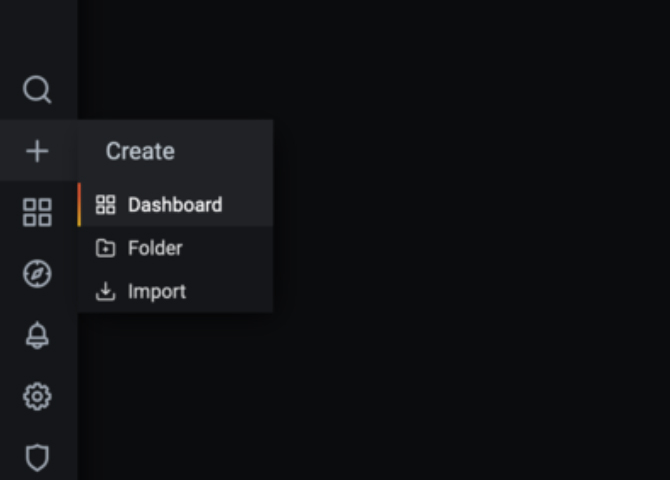
First, you will need to reach the Grafana UI in your browser. Once you have the UI up, navigate to the "+" icon on the left side of the page and select "dashboard". You have now created a dashboard.
Modifying Dashboards
There are many different options to consider when modifying a dashboard. This section will cover the basics.
When you create a dashboard it automatically creates a panel. There are two options on a new panel: Add new panel or Convert to row.
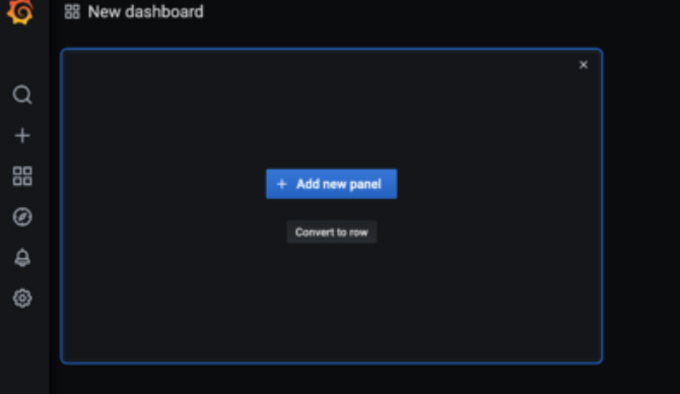
Add new panel creates a panel for you to customize.
Rows are useful for categorizing your panels. For example, if you have several panels that are related, it may be beneficial to group them in a row. More on that later.
Dashboard Options
In the upper right corner of your dashboard, you will see several different options to choose from. Let’s go over each option from left to right.

1. Add panel: This will allow you to add more panels to the dashboard. Simply click it and a new panel will show up for you to customize.
2. Moving Panels: To move a panel, place your cursor at the top of the panel, hold left-click and then drag the panel to your preferred location.
3. Resizing Panels: To resize a panel, place your cursor at the bottom right corner of the panel, left-click and drag your mouse away from the panel to make it larger or into the panel to make it smaller.
4. Save dashboard: Use this to save what you have created. If you refresh the browser you will lose your progress if you do not save.
5. Dashboard settings: Here you can do things such as name your dashboard, create variables, annotations, links, and even view the json model of your dashboard. We will go over these now.
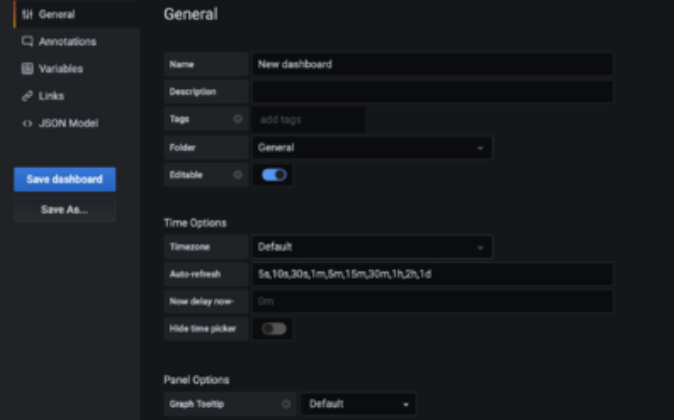
1. General: Here you can give your dashboard a name, set auto refresh times to have the panels automatically update, and more.
2. Annotation: Annotations provide a way to integrate event data into your graphs. They are visualized as vertical lines and icons on all graph panels. When you hover over an annotation icon you can get event text & tags for the event. You can add annotation events directly from grafana by holding CTRL or CMD + click on graph (or drag region). These will be stored in Grafana's annotation database.
3. Variables: Variables enable more interactive and dynamic dashboards. Instead of hard-coding things like server or sensor names in your metric queries you can use variables in their place. Variables are shown as dropdown select boxes at the top of the dashboard. These dropdowns make it easy to change the data being displayed in your dashboard.
4. Links: Dashboard Links allow you to place links to other dashboards and web sites directly below the dashboard header.
5. Json Model: The JSON Model is a data structure that defines the dashboard. Including settings, panel settings & layout, queries etc.
6. Cycle view mode: Pressing this once will hide the icons that are located on the left of the screen and if you press it a second time it will hide the icons in the top right corner. To see the icons again press escape.
7. Time range: Press this to see a drop down menu where you can set the time range for your graphs. You can see from the last 5 minutes to the last 7 days. You can also look back at specific time ranges. If you want to see what the graph looked like from 2pm - 3pm the day before, you can set that range and view it.
8. Time range zoom out: Pressing this will double the time range. For example, if it is set to the last one hour it will change to a range of 2 hours.
9. Refresh dashboard: Press this to update your graphs with the most recent data.
10. Auto refresh: Press this to see a drop down menu that will allow you to select what interval you want the dashboard to automatically update to show the most recent data.
Adding a new panel
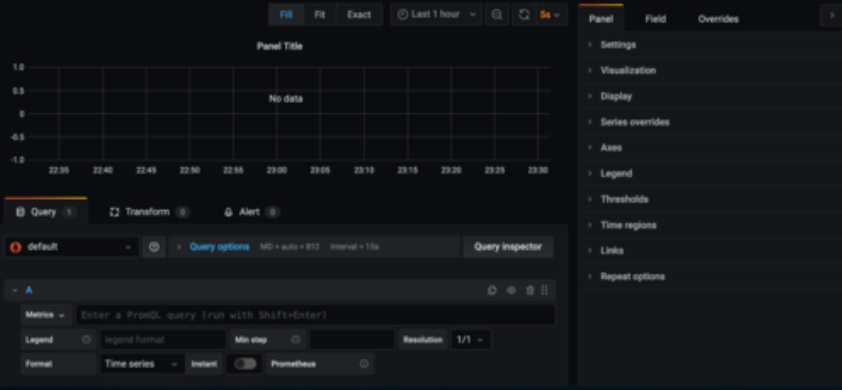
After selecting "Add new panel," you will be able to customize a panel. Grafana defaults to the graph visualization when you add a new panel, but there are many to choose from, such as stat panels, heatmaps, and more. Each visualization has categories to edit but not all visualizations have the same categories. For example, the graph visualization has axes that you can customize but the stat panel does not. You can select what style you want to use under the visualization category.
Displaying data
Here we have the query section of the panel. Queries are what Grafana uses to get the data from the data source. This section may look different depending on the data source you are using. The example below uses the Prometheus data source. We will go over the sections required to show data below.
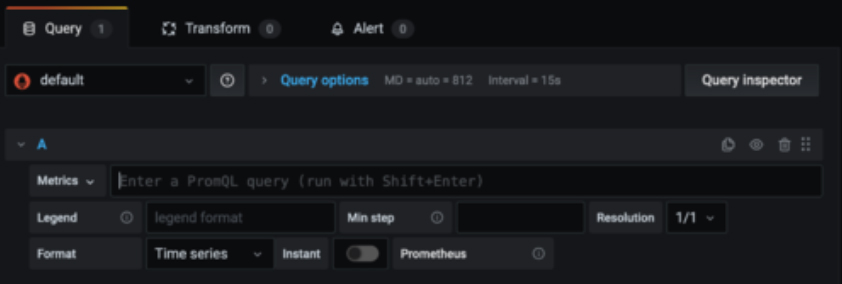
1. Data source: In the above example, the data source selected is "default". You can designate one of the data sources you add as default. To change the data source just click that box and a drop down will appear with the data sources you have added.
2. Metrics: The metrics drop down will list the different query options your data source has. The block next to it is where you will enter your query.
Rows
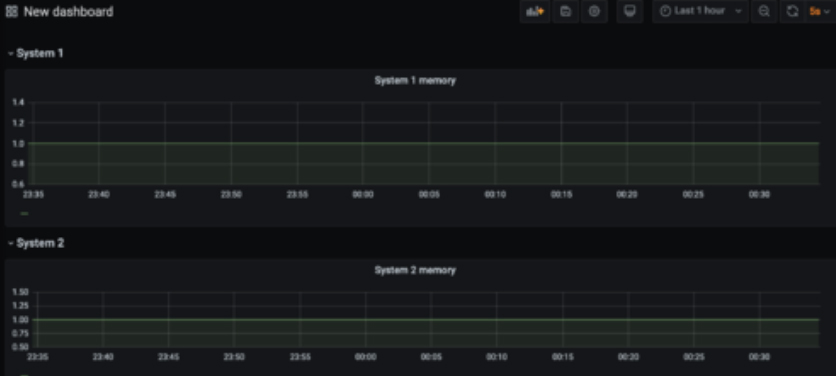
Rows can be useful for organizing your dashboards. You can give rows titles as well. In the example below there are memory graphs for system 1 and system 2. Two rows were created and the system memory panels were placed under their respective row.
Conclusion
We hope this tutorial about the basics of creating and modifying a Grafana dashboard has been helpful to you!
For more in-depth information on working with Grafana, go to the tutorials page on Grafana's website, and always remember that Awnix is here to help as well.